
Accelerate Marker Gene Detection in scRNA-seq: A No-Code Approach
Uncover the essentials of marker gene identification in single-cell RNA sequencing. This article covers no-code solutions, methodologies, and case studies across various fields.
Single-cell RNA sequencing (scRNA-seq) has transformed our ability to profile gene expression at the level of individual cells. A crucial step in interpreting scRNA-seq data is marker gene identification – finding genes that characterize specific cell types or states. Traditionally, marker gene identification required coding skills and tools like Seurat in R or Scanpy in Python. However, new no-code platforms like Nygen are making marker gene detection accessible to all researchers, enabling sophisticated analyses through an intuitive interface. In this article, we dive deep into how marker genes are identified in scRNA-seq data (with and without programming), explore both cluster-based and trajectory-based approaches, and illustrate how Nygen’s no-code platform empowers marker gene selection and analysis across conditions and dynamic processes. We’ll also discuss different types of marker genes, key statistical parameters, a step-by-step no-code workflow, validation strategies, common challenges (and solutions), and real-world case studies in immunology, stem cells, neuroscience, and cancer.
1. Understanding Marker Genes in Single-Cell Data
In scRNA-seq analysis, a marker gene is typically defined as a gene whose expression is highly specific to a particular cell population (or state) compared to others. Biologically, a specific marker gene or a combination of marker genes help identify and name cell types (e.g., CD3 for T cells, Albumin for hepatocytes) or reveal cell states (e.g., activation markers). Not all marker genes are the same, and they can be categorized into different types, each with implications for how we detect and use them.
| Marker Type | Description | Practical Notes |
|---|---|---|
| Unique | Expressed exclusively in one cell type/cluster and not in others. Ideal for unambiguous identification. | Truly unique markers are rare — most genes have some low-level expression elsewhere. Particularly challenging to identify in heterogeneous datasets such as whole embryo RNA-Seq. |
| Enriched | Highly expressed in the target cell type compared to others, but not entirely exclusive. Shows strong upregulation or much higher expression than background. | Serves as practical markers, though other cells might express them at lower levels. |
| Combinatorial | A panel where no single gene is uniquely specific, but a combination of genes together defines the cell type. | For closely related cell types (e.g., CD4/CD8 double positive T cells), a set of markers is needed. Tools like COMET search for multi-gene marker panels. |
| Negative | A gene notably absent in the target population but present in others. The lack of expression marks the cell type. | For example, a receptor expressed on all but one cell type — that cell type can be identified by the receptor’s absence. |
Table 1: Types of cell marker genes and their characteristics. A single gene can sometimes fall into multiple categories depending on context. For example, a gene might be uniquely expressed in one subtype among an organism’s cells (unique marker), but within a narrower context (like within T cell subtypes) it could be merely enriched. Combinatorial markers may require specialized algorithms to find optimal gene sets. Negative markers remind us that sometimes what a cell does not express is as informative as what it does express (for example, ScType explicitly allows negative markers in its reference definitions).
2. Approaches to Marker Gene Identification: Cluster-Based vs Trajectory-Based
Marker gene identification strategies generally fall into two broad approaches:
- Cluster-based marker identification – finding markers for distinct cell clusters or types in a static snapshot.
- Trajectory-based marker identification – finding dynamic markers that change along a continuum (e.g., a developmental or differentiation trajectory).
Let’s explore each approach and the tools associated with them.
Cluster-Based Marker Gene Identification
In most scRNA-seq studies, after initial data processing (normalization, dimensionality reduction) the cells are grouped into clusters representing putative cell types. Cluster-based marker identification involves discovering genes that are differentially expressed in one cluster versus others. This is often done to annotate clusters with known cell type identities or to discover new cell-type-specific genes.
Differential expression (DE) testing is at the core of this approach. Common strategies include comparing each cluster against all other cells (one-vs-all testing) or performing pairwise comparisons between clusters. Tools like Seurat (in R) provide convenient functions (FindAllMarkers) to perform such tests (usually using Wilcoxon rank-sum or t-tests) and return a list of candidate markers per cluster. Simpler statistical methods like the Wilcoxon test, t-test, or logistic regression have proven surprisingly effective for marker gene detection, often ranking genes by fold-change and significance. Recent benchmarking studies have demonstrated that these basic statistical approaches frequently outperform more complex single-cell-specific methods in identifying reliable marker genes, highlighting that sophisticated algorithms don't always yield better results in this context.
Key considerations in cluster-based marker detection include the magnitude of upregulation, the percentage of cells in the cluster expressing the gene, and statistical significance. We will discuss these parameters in detail shortly. For robust results, many pipelines also combine results from multiple comparisons. For example, the scran findMarkers() function in Bioconductor performs pairwise tests between clusters and then aggregates results to yield markers that best distinguish each cluster. This approach attempts to find a minimal set of genes that together uniquely identify the cluster – touching on the idea of combinatorial markers.
It’s important to note that one-vs-all DE can sometimes pick up genes that are expressed in multiple related clusters. For instance, if two clusters are very similar (e.g., naive vs memory T cells), their top DE genes may overlap or fail to cleanly separate them.
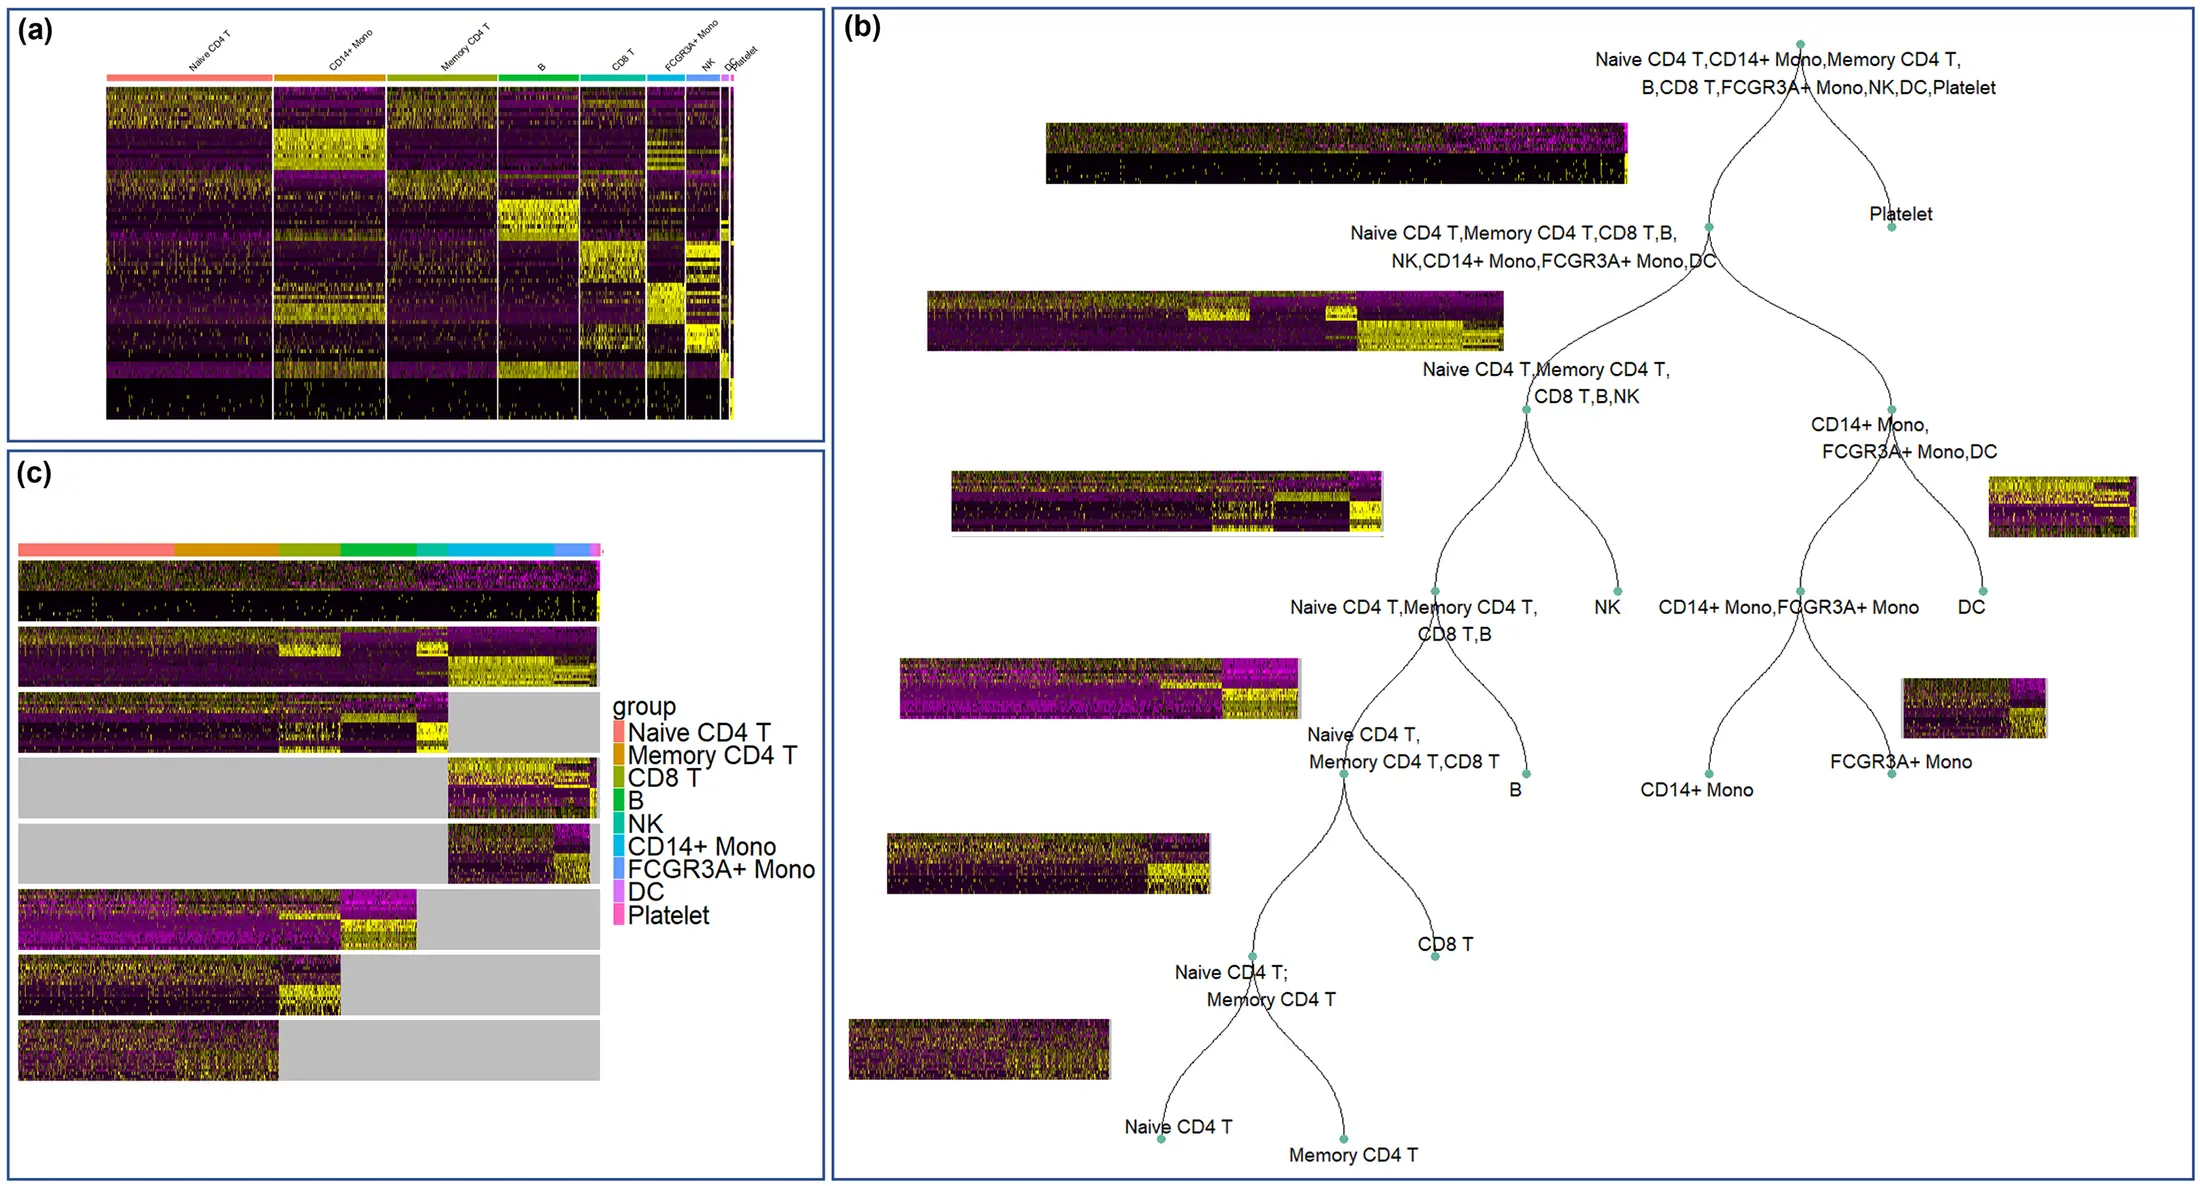
Figure 1: Heatmap of marker genes for cell clusters in a Peripheral Blood Mononuclear Cell (PBMC) dataset (one-vs-all Seurat approach). Each vertical stripe is a cluster labeled by cell type. Yellow indicates high expression, purple low. Off-diagonal blocks show some marker genes for one cluster also being expressed in another cluster. For example, markers for Naive CD4 T cells (cluster 1) are also highly expressed in Memory CD4 T cells (cluster 3), reflecting their close relationship. This indicates enriched markers that are not entirely unique, necessitating combinatorial approaches or hierarchical clustering to fully distinguish such closely related cell types.
Tools and algorithms have been developed to refine cluster marker selection in such scenarios. The example in Figure 1 comes from a study proposing hierarchical marker selection. Other advanced methods include COSG, scGeneFit, and COMET:
- COSG (Cosine Similarity Based Marker Gene Identification): A fast method that ranks genes by their specificity to a cluster using cosine similarity. COSG can handle multiple modalities (e.g., scRNA-seq, scATAC-seq, spatial data) and is extremely scalable–finding markers for a million cells in under 2 minutes. It focuses on identifying more indicative and specific markers than traditional DE, aiming to reduce false positives.
- scGeneFit: An approach that uses a compressive linear programming framework to select an optimal set of markers for distinguishing cell types. Rather than picking genes solely by individual p-values, scGeneFit selects genes that jointly maximize cell type classification accuracy. This label-aware method often finds a minimal panel of genes that can recover the known cell labels effectively.
- COMET (Combining Optimal Marker Expressions and Testing): A framework explicitly designed to find combinatorial markers. COMET tests all combinations of up to k genes to identify multi-gene marker panels that uniquely label a population. It uses an efficient hypergeometric test to rank panels, and notably, COMET was validated by experimentally staining cells for the predicted markers. In some studies, flow cytometry confirmed that COMET’s top single-gene and multi-gene panels accurately identified target cell subtypes. This highlights how combinatorial marker gene selection can succeed where single genes alone might not suffice.
Cluster-based marker identification is widely used for cell type annotation – assigning biological identities to clusters using known markers. In fact, a common early step after clustering is to see if clusters express expected lineage markers (e.g., lymphocyte clusters expressing CD3, myeloid clusters expressing CD14, etc.). The selected marker genes can be cross-referenced with databases or literature to label clusters. Tools like Seurat and others output the key stats for each marker gene which we interpret through metrics like fold change and adjusted p-values.
Trajectory-Based Marker Gene Identification
Not all biological questions can be answered by static clusters. In developmental biology, differentiation, or response to stimuli, cells often follow a continuous trajectory or pseudotime path rather than forming discrete clusters. Trajectory-based marker identification aims to find genes that change over a continuum of cellular states.
Algorithms such as Monocle 3 and Slingshot infer trajectories by ordering cells along developmental paths. Once a trajectory (or multiple branching lineages) is established, one can find dynamic markers – genes whose expression is significantly associated with the progression along the trajectory. Monocle pioneered the concept of pseudotime DE analysis, using models to test which genes vary with pseudotime. For example, Monocle 3 can apply a Moran’s I test (a measure of autocorrelation) to identify genes that change in a smooth manner along the trajectory. These genes might mark transitional states or milestones (e.g., a transcription factor that switches on midway through differentiation).
A use case for trajectory-based marker detection is in stem cell differentiation. Imagine profiling cells as stem cells differentiate into mature cell types. Clustering might split early vs late cells, but trajectory analysis could reveal a gradual upregulation of certain genes (say, a series of developmental regulators) as cells progress. Those genes are candidate markers of specific differentiation stages. RNA velocity analysis can further complement this by predicting the future state of cells based on unspliced mRNAs, effectively indicating the direction of change.
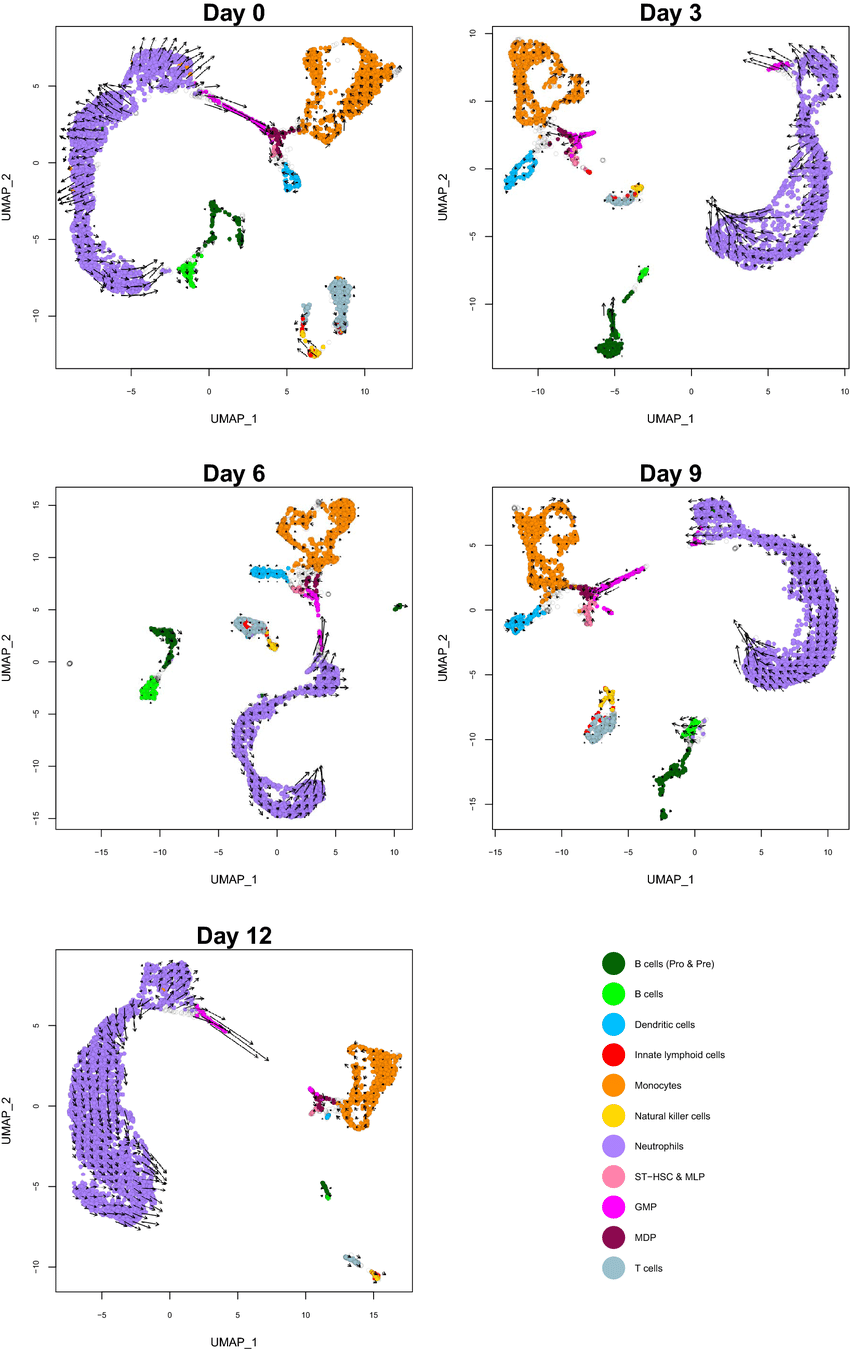
Figure 02: RNA velocity estimates for each cell type over time
For instance, RNA velocity can show arrows on a UMAP plot pointing cells toward their likely future clusters . Genes with high velocity in certain cells might be up-and-coming markers (about to be expressed). In practice, RNA velocity is used to refine trajectories and can highlight dynamic expression changes that aren’t evident from current expression alone.
While cluster-based methods typically yield marker genes defining end states (cell types), trajectory methods find drivers of change. Tools like CellRank and tradeSeq (which fits GAM curves to expression over pseudotime) also fall in this category, helping pinpoint branch-specific markers or early response genes.
Multi-condition trajectories: In some studies, trajectories are compared across conditions (e.g., disease vs healthy). One might identify trajectory-dependent markers that appear only under certain conditions or are shifted in timing. Beyond traditional clustering and trajectory approaches, methods like Milo offer alternative strategies by analyzing cellular neighborhoods to detect differential abundance between conditions. Nygen's platform facilitates these various comparisons, allowing researchers to do dynamic marker discovery in a no-code setting – for example, by selecting specific cell sets, ordering them along pseudotime, and then overlaying these pseudotime analyses for different experimental conditions to highlight gene expression changes unique to one condition.
3. Key Statistical Parameters for Marker Detection
When identifying marker genes (especially in cluster-based analysis), several statistical parameters are considered to gauge each gene’s importance. Here’s a checklist of key metrics and what they mean:
- Fold Change (FC): Typically the log₂ fold change of the gene’s expression in the target group (cluster or state) versus a reference (other cells). A high fold change means the gene is much more expressed in the target population. For marker genes, we often look for large positive fold changes indicating strong enrichment. For example, a log₂FC of 3 means 8-fold higher expression in the cluster compared to others.
- P-value: The significance from a statistical test (e.g., Wilcoxon test or t-test) indicating if the expression difference is likely to be real or due to chance. A low p-value (<< 0.05) means it’s very unlikely the gene’s differential expression happened randomly. Thousands of genes are tested, so raw p-values must be interpreted with caution.
- FDR (Adjusted P-value): The False Discovery Rate adjusted p-value (often using methods like Benjamini-Hochberg). This accounts for multiple testing. Marker gene lists are usually filtered by an FDR threshold (e.g., 0.01 or 0.05) to ensure we have high-confidence genes. An adjusted p-value < 0.05 means the gene is a significant marker with low false discovery chance, after correcting for the many genes tested.
- % Expressing Cells: The percentage of cells in the cluster (and sometimes in the reference set) that express the gene above a detection threshold. This is important because a gene could have a high fold change due to a few cells with very high expression. We prefer markers that are expressed in a large fraction of the target cells (e.g., “pct.1” in Seurat outputs) – ideally the majority of cells in that cluster. We also consider if the gene is largely absent in other clusters (low “pct.2” in Seurat, for example). A good marker might be expressed in, say, 80% of cluster cells and 5% of other cells.
- Mean or Median Expression: The average expression level of the gene in the cluster vs others. This complements fold change by giving a sense of absolute expression. Some marker selection methods require a gene to be expressed above a certain minimum level to be considered (to avoid very low-level transcripts). For instance, NS-Forest requires markers to have a median expression above 0 in the target cluster and to be expressed in >50% of cells. In practical terms, a gene with a tiny counts difference might be statistically significant in large data, but we favor markers with substantial and consistent expression in the target cells.
Nygen, for example, computes a Marker Score between 0 and 1 that reflects a gene's specificity and consistency as a marker (Learn more about the marker scores calculated for each cluster and how to interpret these scores.). This score balances expression level and specificity across clusters: a score of 1 would mean a perfect marker exclusively expressed in one cluster. Marker scores are beneficial for comparing marker strength across genes or datasets, and unlike raw p-values, they remain interpretable regardless of cluster size. In essence, a high marker score in Nygen indicates a gene that's both highly expressed in the target cluster and relatively low elsewhere – an intuitive way to rank markers.
4. Biological Validation of Marker Genes
Computational identification of marker genes is powerful, but biological validation is essential. Once you've shortlisted marker genes for a cell type or state, you'll want to confirm their relevance in the lab. Here are common strategies for validating marker genes:
- Quantitative PCR (qPCR): A straightforward method to validate that a gene is differentially expressed. You can isolate the cell population of interest (e.g., by fluorescence-activated cell sorting if a surface marker is known, or by using your scRNA-seq clustering to guide which cells correspond to which population) and perform qPCR for the candidate marker genes. qPCR will confirm if those genes have higher transcript levels in that population versus others. It's a quick and quantitative check, often used for a handful of top markers.
- Fluorescent In Situ Hybridization (FISH): Techniques like RNA FISH or the more recent multiplexed methods (e.g., smFISH, MERFISH) allow you to visualize gene expression in intact cells or tissue sections. By designing probes for your marker gene, you can see if the fluorescence signal appears specifically in the cells of the expected type/location. FISH is great for spatial validation – for example, if scRNA-seq found a rare cell type defined by marker X in brain tissue, FISH can show the physical position of X-expressing cells, confirming identity and distribution.
- Immunohistochemistry (IHC) or Immunofluorescence: If an antibody exists for the marker gene's protein, you can perform IHC on tissue or immunofluorescence on cell samples. This will detect the protein product of the marker gene. IHC is commonly used to validate markers in tissue pathology – e.g., staining a tumor biopsy for a new marker gene to see if it highlights a specific subset of cells (perhaps cancer stem cells or a particular immune infiltrate). Co-staining with known markers can further confirm the cell identity.
- Flow Cytometry (FACS): Many canonical cell markers are surface proteins, and flow cytometry is the go-to method for validating and purifying cell populations based on markers. If your scRNA-seq marker gene is a surface protein (or can be engineered as one), you can design a flow cytometry panel to detect it. Validation might involve showing that cells positive for this new marker correspond to the cluster from which it was identified. In cases of combinatorial markers, flow cytometry can test panels: for example, COMET's multi-gene markers were validated by staining cells with multiple antibodies simultaneously and showing that the combination gated exactly the intended population. Flow cytometry provides quantitative single-cell validation and can even allow you to sort cells and perform functional assays on the purported cell type.
- CITE-seq: This cutting-edge approach combines single-cell RNA sequencing with antibody detection, allowing simultaneous measurement of gene expression and protein levels in the same cells. CITE-seq is particularly valuable for validating whether transcriptional markers translate to protein-level differences, providing a direct link between mRNA and protein expression. Platforms like Nygen support CITE-seq data analysis, enabling researchers to correlate RNA-derived markers with their protein counterparts in a single experiment, streamlining the validation process.
Each of these methods has its strengths – qPCR is fast and quantitative for transcripts, FISH/IHC give spatial resolution, flow cytometry provides single-cell protein-level verification and sorting capability, and CITE-seq offers simultaneous RNA and protein profiling. In practice, researchers often use a combination. For instance, you might first do qPCR to check a panel of candidates, then do a targeted FISH or IHC of the most promising marker in tissue, and perhaps use flow cytometry if you need to isolate those cells. By confirming that the computationally identified marker genes truly label the intended cells in independent assays, you add credence to your findings. These validation experiments close the loop from computation back to biology.
5. Common Challenges in Marker Gene Selection and No-Code Solutions
Identifying marker genes is not always straightforward. Several challenges can arise, especially with complex or noisy scRNA-seq data. Fortunately, no-code platforms like Nygen incorporate solutions to many of these issues, either through built-in features or by enabling iterative exploration to troubleshoot problems.
Issue: Batch effects can lead to spurious “markers” that actually reflect technical biases (e.g., one sample has higher overall expression for certain genes).
Solution: Use the platform's batch correction integration. Nygen, for example, offers batch correction with parameter selections for a new analysis during preprocessing. This removes technical noise so that marker detection finds true biological differences. Always ensure batches are corrected/combined before finding markers in a merged dataset.
Issue: Cell types that are very similar (e.g., subtypes of T cells or similar neuron subtypes) may share most marker genes, making unique markers hard to find. One cluster’s enriched marker may also be expressed in the other.
Solution: Consider a combinatorial marker approach. No-code tools could allow you to overlay expression of multiple genes at once (e.g., check co-expression plots) to identify a unique combination. Also, using hierarchical clustering of cells (which Nygen can do by adjusting clustering resolution) might group such similar cells together first, then allow sub-clustering to find subtle markers. Some advanced no-code analytics (perhaps via an AI assistant) might suggest markers that together differentiate the groups.
Issue: scRNA-seq data is noisy with many zeros. A true marker might not be detected if it’s dropped out in many cells, or it might appear “negative” in the cluster due to dropout.
Solution: Use percentage expressing thresholds. Nygen's marker filters require a minimum % of cells expressing the gene. This helps ensure the marker is robust, not driven by a few outlier cells. Additionally, some platforms allow imputation or smoothing of data as a toggle – though one must be cautious – to mitigate dropout effects before marker selection.
Issue: Differential expression can yield dozens or hundreds of significant genes per cluster. Not all are truly specific “marker” genes, and it’s hard to know which to focus on.
Solution: Utilize the marker scoring or ranking provided. Nygen’s marker score condenses specificity and consistency into a 0–1 score. Focus on top-scoring markers for each cluster. Interactive volcano plots or ranking charts in the UI can help visually pick the best markers. And since it’s no-code, you can easily apply stricter filters (increase fold change cutoff, etc.) and immediately see the list shortened to the most robust markers.
Issue: After finding markers, you might be unsure which cell type they correspond to, especially if markers are novel.
Solution: Leverage built-in knowledge. Nygen’s platform integrates curated marker databases and even AI-driven suggestions (Nygen Insights uses a cell type knowledge base). The no-code interface might allow you to input a marker gene and query known cell types that express it. This helps identify your cluster. Moreover, you can bring in reference datasets (Nygen can connect to a database of published single-cell datasets) to see if your cluster’s markers match known cell populations – all with a few clicks.
By incorporating robust statistical methods and reference knowledge, no-code tools help ensure that the marker genes you identify are biologically meaningful and not just artifacts. Moreover, the interactive nature of platforms like Nygen means you can quickly iterate: if an initial marker list looks off (perhaps due to a challenge like those above), you can adjust parameters or try alternative approaches (e.g. group two clusters and rerun marker detection) to resolve ambiguities.
6. Case Studies: Real-World Applications of Marker Gene Analysis
To ground these concepts, let’s look at how marker gene identification is applied in various research domains, and how no-code approaches can accelerate insights:
- Immunology (e.g., PBMCs and T cell subsets): The immune system contains many closely related cell types. Single-cell studies of peripheral blood mononuclear cells (PBMCs) often identify clusters for T cells, B cells, NK cells, monocytes, etc. A classic challenge is distinguishing subtypes like Naive vs Memory T cells or different dendritic cell subsets. Using a no-code tool on a PBMC dataset, a researcher can quickly find marker genes such as CCR7 and SELL (CD62L) enriched in naive T cells, versus CXCR3 or GZMK in certain memory T cells. As shown earlier, naive and memory T cells share some marker genes, but by examining multiple markers in combination (perhaps using Nygen’s gene co-expression view), one can craft a panel: for example, Naive T cells = CCR7 high and lack GZMK, whereas a subset of Memory T = GZMK high with lower CCR7. Immunologists often validate these markers by flow cytometry – indeed many scRNA-discovered markers end up as new antibody targets for cell sorting. The no-code platform allows immunologists unfamiliar with bioinformatics to directly engage with their single-cell data, testing their immunological hunches (like “is there a regulatory T cell cluster and what markers define it?”) interactively.
- Stem Cells & Developmental Trajectories: Consider a study of stem cells differentiating into a particular lineage (neuronal, hematopoietic, etc.). Instead of static clusters, one might use pseudotime analysis. For example, analyzing single-cell RNA-seq of hematopoietic stem cells maturing into progenitors, one could identify a trajectory where early stem cells gradually transition to committed progenitors. A no-code tool can reveal dynamic markers: perhaps Meis1 and Gata2 are high in early progenitors and then switch off, while Itga2b (CD41) comes on as megakaryocyte commitment begins. With Nygen's trajectory module, a developmental biologist could see these trends without writing complex Monocle3 code – just by selecting the source and sink, groups of cells that define the start and the end of the pseudotime ordering, and letting the platform highlight the top genes changing over time. Such markers might then be validated by time-course qPCR during an in vitro differentiation, or by checking protein expression at various time points. This approach is invaluable in stem cell research to pinpoint key regulators at different stages.
- Neuroscience (brain cell types): The brain has an enormous diversity of cell types, and often these are distinguished by subtle transcriptional differences. For example, single-cell studies of the cortex might find dozens of inhibitory neuron subtypes. Many neuronal subtypes are defined by combinatorial markers (e.g., a specific neuropeptide, a calcium-binding protein, and a receptor). With a no-code single-cell platform, neuroscientists can parse through clusters of interneurons and see, say, one cluster is defined by Pvalb (parvalbumin) and another by Sst (somatostatin). But within the Sst+ neurons, subclusters might have different levels of Calb2 or co-expression of Nos1. By using the differential expression tools, one can identify these enriched markers. If no single gene cleanly separates two subtypes, one can use the platform to find multi-gene signature scores for each cluster. Nygen’s marker score helps here by quantifying how uniquely a gene like Pvalb marks its cluster (likely near 1.0 for the fast-spiking PV interneurons). Neuroscientists can then use in situ hybridization to validate that “Cluster X” neurons identified in silico indeed express those marker genes in brain slices. The no-code interface thus accelerates cell-type discovery in complex tissues by enabling domain experts to directly interrogate expression patterns.
- Cancer (tumor microenvironment and cancer cells): Tumors often contain diverse cell populations – cancer cells in various states, immune and stromal cells, etc. Marker gene identification is crucial for delineating these in single-cell oncology studies. For example, in a tumor scRNA-seq, one might find a cluster of T cells expressing exhaustion markers PDCD1 (PD-1) and CTLA4, indicating exhausted T cells, while another T cell cluster expresses GNLY and NKG7, indicating cytotoxic NK-like T cells. Meanwhile, among the malignant cells, one could find subclusters with a proliferative signature versus a drug-resistant signature, each defined by marker genes (e.g., a stemness marker like ALDH1A1 high in one subclone). Using a platform like Nygen, cancer biologists can compare samples from patients before and after therapy: the tool could directly highlight which marker genes are gained or lost in certain cell clusters post-treatment (dynamic or condition-specific markers). For instance, a case study might reveal that after chemotherapy, the tumor has a new cluster of cells with high expression of SOX2 and BCL2 – potential markers of a resistant cancer stem cell population. These would be obvious targets for follow-up, perhaps validated by IHC staining of tumor sections to see if SOX2 and BCL2 co-expression identifies cells that survived treatment. No-code analysis empowers researchers to do this kind of comparison quickly, guiding experiments to understand and overcome resistance in cancer.
Across all these scenarios – immunology, development, neuroscience, cancer – the themes are similar. Marker genes are the threads that let us weave a narrative about cell identity and function. By lowering the computational barriers, platforms like Nygen let researchers focus on the science: formulating hypotheses (“I expect these cells have these markers”), testing them instantly on the data, and then planning validation experiments. Real-world data is messy, but interactive no-code workflows make it feasible to explore many angles (different clustering resolutions, subsetting cell types, comparing conditions) to ensure the markers you end up with are solid.
Final Considerations
Marker gene identification in scRNA-seq data is both an art and a science – balancing statistical rigor with biological insight. We’ve covered how marker genes can be unique, enriched, combinatorial, or even negative, and how both cluster-based and trajectory-based methods are used to find them. With traditional tools like Seurat, Monocle 3, Slingshot, and newer methods like COSG, scGeneFit, and COMET, the field has developed powerful techniques to discover meaningful markers. Now, innovative platforms such as Nygen.io are bringing these capabilities to a broader audience through no-code interfaces. Nygen integrates these best practices (from differential expression to pseudotime analysis) into a user-friendly workflow, supplemented by features like multi-condition comparison, dynamic marker discovery, and marker scoring for quality assessment.
The ability to perform sophisticated single-cell analyses without programming lowers the entry barrier for many biologists and clinicians. It accelerates the cycle from data to discovery, enabling more iterative and collaborative research. Imagine being able to upload your data and within hours not only get clusters but also a ready list of marker genes to test in the lab – all without hunting down code or wrestling with dependencies. That is the promise of no-code single-cell analytics.
Related articles

No-Code Workflow for Marker Gene Identification (Step-by-Step) on Nygen
Learn how to identify marker genes in single-cell RNA-seq data without coding using Nygen's intuitive platform. This step-by-step guide covers data upload, quality control, clustering, marker detection, and dynamic analysis with detailed screenshots and expert tips.
Read more →
Navigating the Complexity of Single-Cell RNA-Seq Data Analysis
Explore key challenges and advanced strategies in scRNA-seq data analysis for both new and experienced researchers.
Read more →
Integrating Multi-Omics Data for Effective Target Identification in Drug Discovery
Discover how multi-omics integration is reshaping drug discovery by uncovering disease mechanisms, prioritizing drug targets, and connecting genomics, epigenomics, transcriptomics, proteomics, and metabolomics into a usable biological model.
Read more →