
How can researchers perform marker gene identification without writing code? Platforms like Nygen.io have streamlined the single-cell analysis workflow into a series of interactive steps. Here is a step-by-step no-code workflow for identifying marker genes using Nygen.

Upload your single-cell data to the platform. Nygen supports input of a raw count matrix or processed data from common pipelines (10x, BD, Seurat, etc.). If you have multiple samples or conditions, you can upload and assign metadata (e.g., condition labels) for each cell. This sets the stage for multi-condition comparisons later.
Through the web interface, perform quality control filters (e.g., remove cells with low reads or high mitochondrial gene percentage) using simple sliders or preset options. Next, initiate normalization and scaling of the data. Nygen automatically handles library size normalization and log transformation. If multiple datasets or batches are present, enable the batch correction/integration option – Nygen will correct batch effects so that downstream marker analysis isn’t confounded by technical differences (Read more about our comparison of powerful scRNA-seq Data Analysis Tools in 2025).


Run clustering analysis by selecting the desired resolution (a slider for coarse to fine clustering) and choose a dimensionality reduction method (PCA for analysis, UMAP/t-SNE for visualization). The platform computes principal components, lets you choose how many to use, and then clusters the cells (often via graph-based methods like Leiden).
In Nygen, this might be as easy as clicking "Start Analysis" (we provide default parameters to help users get started with analysis) and waiting for the results to appear as colored clusters on a UMAP plot. No coding needed – just interpret the resulting clusters.

Once clusters are defined, use the Find Markers function. In Nygen's interface, a default one vs all marker search is done for Leiden clusters when you run an analysis. The platform then performs differential expression analysis under the hood and returns a table of marker genes for each cluster, complete with marker scores, mean expression, and fraction expressed. Here you can interactively sort genes in the table by score, fold change, etc., and search for specific genes within the table. The marker lists update instantly, showing you the refined selection. You can sort genes by marker score to see the top markers. Visualizations like violin plots and dot plots of the marker genes can usually be generated with one click to help you evaluate marker quality. For more detailed information on interpreting these markers, refer to Nygen's Knowledge base article section on marker interpretation.


Nygen's new AI-powered gene information feature provides instant access to comprehensive gene summaries directly within the analysis workflow. When exploring marker genes, users can simply click on any gene of interest to receive a detailed summary about its biological function, expression patterns, and relevance to specific cellular processes or diseases. This intelligent integration pulls information from curated scientific literature and databases, automatically citing sources for accuracy and credibility. This feature streamlines the interpretation process, allowing researchers to immediately contextualize their findings without leaving the platform or searching through external resources.

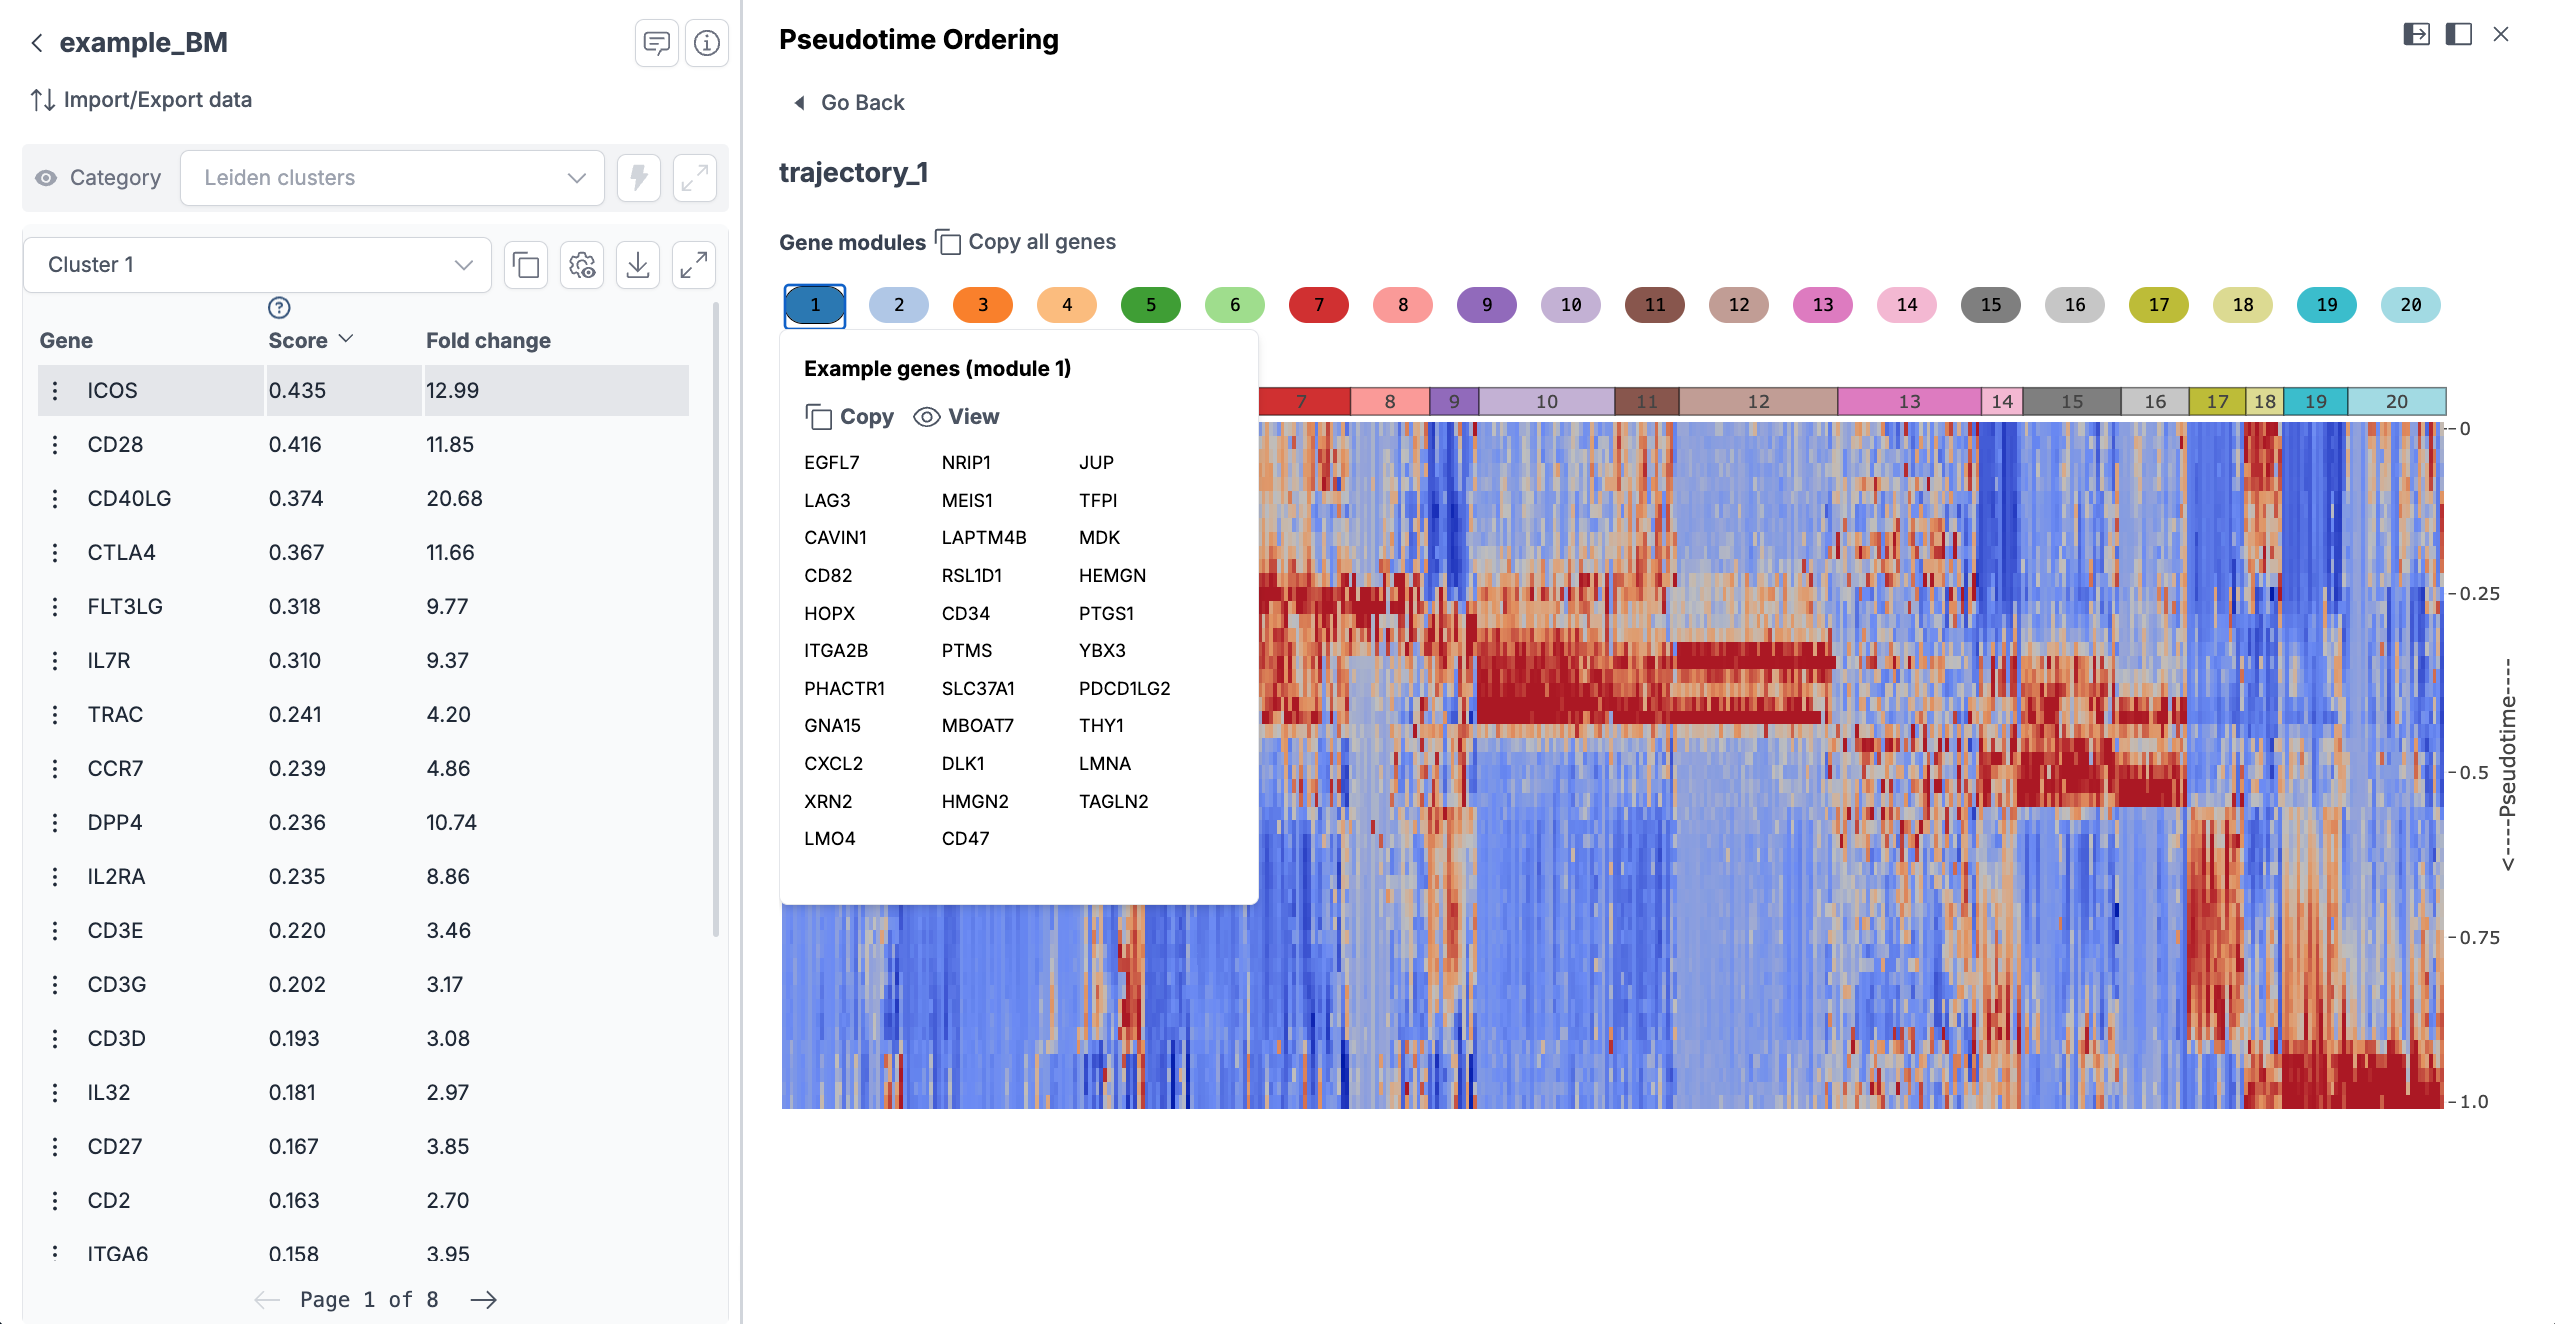
If your data involves a continuous process (like a time series or differentiation experiment), you can perform trajectory analysis without coding. Nygen offers a pseudotime analysis module where you might select a set of cells or clusters to order along a trajectory. By clicking "Run Trajectory Analysis," the platform infers a pseudotime ordering (displayed on UMAP). When you run pseudotime analysis, marker genes in each module are calculated automatically with no extra step required. These could be early vs late markers of the process. The results are shown as a heatmap with modules, and you can visualize each gene's expression along the trajectory. This no-code approach replaces what would otherwise require coding with Monocle or tradeSeq. For more details, refer to Nygen's knowledge base article on pseudotime analysis.
One powerful aspect of Nygen is analyzing multiple conditions side by side. If you uploaded data from, say, a control vs treated sample or healthy vs disease, you can use the interface to compare marker genes across conditions. For example, after clustering, you might identify cluster 5 as a cell type present in both conditions. Nygen can find markers of cluster 5 within each condition and highlight differences. Alternatively, you can perform a differential expression between the same cell type under two conditions (to find condition-specific markers). This might involve selecting condition labels in a dropdown and running a built-in DE analysis. Nygen's cell filtering feature allows users to define cell populations with custom filters and use them for deeper analysis by filtering by category, cluster, imported groups, and more. The no-code platform will output genes that are markers in one condition's cluster vs the other (an interaction effect). This is extremely useful for finding, for instance, activation markers that only appear in disease. All without writing a line of R code!

As you identify markers, Nygen provides the Marker Score to help judge each gene. You might focus on genes with high scores (close to 1.0) as the best markers. The platform also allows you to create custom gene sets or signatures – for example, if you have a candidate list of markers from literature, you can input them and Nygen will compute a signature score per cell to see if that signature aligns with your clusters. This helps validate if certain cell clusters in your analysis match known biology. Conversely, you can take your discovered markers and immediately test them: e.g., check their expression in an integrated public dataset or across another condition by loading another dataset in.

Finally, with marker genes identified, a no-code platform lets you easily export the results. You can download the marker gene tables as CSV files directly. Nygen lets you share the dataset with collaborators through its cloud interface. At this stage, you would use the marker genes to annotate clusters – often the platform has an annotation tool where you can label cluster IDs with cell type names manually, or even use an AI-powered auto-annotation (Nygen Insights includes automated cell type annotation based on known marker databases. By the end of this workflow, you have identified and labeled all your cell populations with marker genes, all through a point-and-click experience.

This no-code workflow mirrors the steps an expert would do via programming, but it lowers the barrier to entry. It also speeds up the iteration cycle – you can tweak parameters and re-run analyses in minutes. The result is that even complex analyses like multi-condition marker discovery or trajectory-based gene detection become accessible to researchers who prefer not to code.
Nygen’s comprehensive interface encapsulates best-practice methods (clustering, DE testing, pseudotime analysis, etc.) and enables reproducible analysis with minimal technical overhead. With its comprehensive toolkit and intuitive design, you can uncover the cell marker genes that matter most to your research questions – whether you’re identifying a new cell type, tracking differentiation, comparing disease vs healthy cells, or profiling the tumor microenvironment.